Deep-ocean Assessment and Reporting of Tsunamis (DART)
Tsunami Detection Algorithm
Introduction
Each Deep-ocean Assessment and Reporting of Tsunamis (DART) gauge is designed to detect and report tsunamis on its own, without instructions from land. The tsunami detection algorithm in the gauge's software works by first estimating the amplitudes of the pressure fluctuations within the tsunami frequency band and then testing these amplitudes against a threshold value. The amplitudes are computed by subtracting predicted pressures from the observations, in which the predictions closely match the tides and lower frequency fluctuations. The predictions are updated every 15 seconds, which is the sampling interval of the DART gauges.
Background oceanic noise determines the minimum detection threshold. Based on past observations, a reasonable threshold for the North Pacific is 3 cm (or 30 mm). If the amplitudes exceed the threshold, the gauge goes into a rapid reporting mode to provide detailed information about the tsunami. It remains in this mode for at least four hours.
Form of the Tsunami Detection Algorithm
The tides and lower frequency signals are predicted within a few millimeters using a cubic polynomial that is fit to bottom pressure observations over the past three hours
3 Hp(t')i=0= ? w(i) H*(t-idt)
where the asterisk denotes 10-min averages and dt = 1 hr. The prediction time t' is set to 5.25 minutes, which is half the 10 minute averaging interval plus the 15-second sampling interval for the gauges. The coefficients w(i) come from Newton's formula (II) for forward extrapolation. Using these temporal parameters, the w-coefficients are
- w(0) = 1.16818457031250
- w(1) = -0.28197558593750
- w(2) = 0.14689746093750
- w(3) = -0.03310644531250
A tsunami is detected if the difference between the observed pressure and the prediction Hp exceeds the prescribed threshold in magnitude (30 mm in the North Pacific).
The gauges could use the most recent pressure observation to test against the prediction. However, the next earlier value is used so that the gauges can screen the pressure values for instrumental spikes that might falsely trip the algorithm. The threshold for these spikes is set at 100 mm.
Theoretical Pressure Series
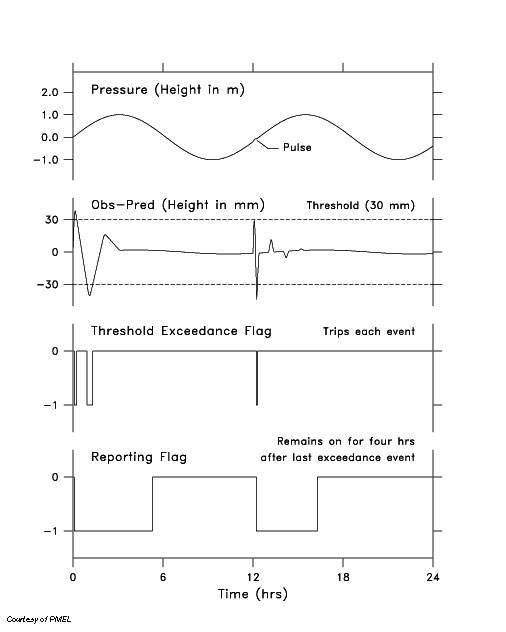
Figure 1 shows the application of the algorithm to a theoretical pressure series. The series consists of an M2 tide with an amplitude of one meter and a short pulse that has an amplitude of 5 cm and a duration of 15 minutes. The pulse affects the difference both directly and through its indirect effect on the prediction. Following the first and largest differences, pulses continue to occur each hour with diminishing amplitude until the pulse no longer influences the predictions.
The difference exceeds the threshold at the beginning of the theoretical series. This is due to the mismatch between the time series and the constant values placed initially in the H* array. This phenomenon will also occur during field deployments of DART gauges as they fall through the water column toward the bottom.
However, the difference will stabilize at sub-threshold values 4-5 hours after the gauges reach the bottom. Then, the H* arrays contain only on-bottom pressure values, and the gauges are in thermal equilibrium with the bottom waters.
As shown in Figure 1, a software flag is set to -1 each time the difference exceeds the threshold. In turn, this exceedance flag controls a reporting flag that puts the DART gauge into its rapid reporting mode. The reporting flag is set to -1 as soon as the threshold is exceeded and remains equal to -1 until four hours has passed since the last time the threshold was exceeded. The gauge then returns to its monitoring mode.
Frequency Response
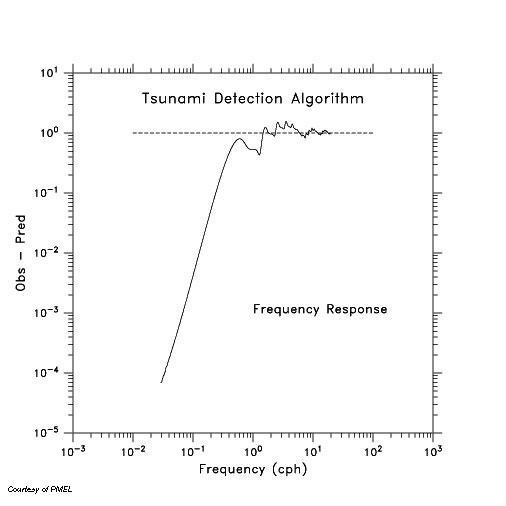
As shown in Figure 2, the pressure difference has a response near unity over the tsunami band, which spans the periods from 2 to 90 minutes. At lower frequencies, the attenuation increases rapidly with decreasing frequency. Hence, tsunami and higher-frequency signals dominate the pressure difference.
Observed Tsunami
Figure 3 shows small-amplitude tsunamis observed by internally recording gauges in the North Pacific. Relative to the high-passed data, the background noise in the difference series is either equal in amplitude or slightly enhanced. Neither tsunami is high enough in amplitude to set a DART gauge into rapid reporting mode.

Observed Rayleigh Waves
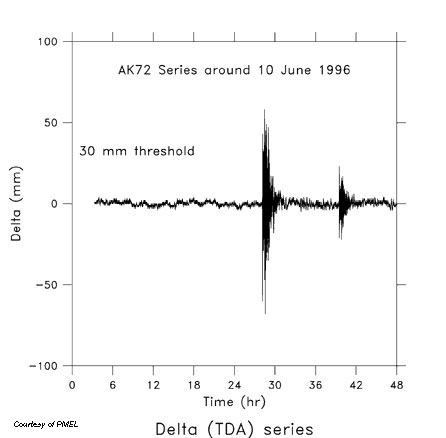
Figure 4 shows pressure differences observed at an internally recording pressure gauge in the northern Gulf of Alaska. The two groups of high-frequency fluctuations are seismic Rayleigh waves caused by the 1996 Andreanof Island earthquakes in the Alaska-Aleutian Subduction Zone. The first group was generated by the main shock, while the second was generated by a smaller aftershock that occurred about eleven hours later. A DART gauge would be set into rapid reporting mode by the first group of Rayleigh waves.
 Deep Sea Crabs