Climate models consistent with ocean warming observations
LIVERMORE, Calif. – Climate models are reliable tools that help researchers better understand the observed record of ocean warming and variability.
That’s the finding of a group of Livermore scientists, who in collaboration with colleagues at Scripps Institution of Oceanography, had earlier established that climate models can replicate the ocean warming observed during the latter half of the 20th century, and that most of this recent warming is caused by human activities.
The observational record also shows substantial variability in ocean heat content on interannual-to-decadal time scales. The new research by Livermore scientists demonstrates that climate models represent this variability much more realistically than previously believed.
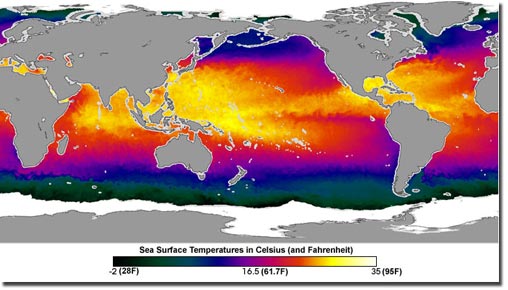
This is an image of global sea surface temperatures taken from Japan National Space Development Agency's (NASDA) AMSR-E instrument aboard NASA's Aqua spacecraft on August 27, 2003. The colors in this false-color map represent temperatures of the ocean's surface waters, ranging from a low of -2?C (28?F) in the darkest green areas to a high of 35?C (95?F) in the brightest yellow-white regions. Sea ice is shown as white and land is dark gray.
Using 13 numerical climate models, the researchers found that the apparent discrepancies between modeled and observed variability can be explained by accounting for changes in observational coverage and instrumentation and by including the effects of volcanic eruptions.
The research, which will appear in the June 18 early online edition of the journal Proceedings of the National Academy of Sciences, casts doubt on recent findings that the top 700-meters of the global ocean cooled markedly from 2003-2005.
“Our analysis shows that the 2003-2005 ‘cooling’ is largely an artifact of a systematic change in the observing system,” said Krishna AchutaRao, previously of Livermore’s Program for Climate Model Diagnosis and Intercomparison (PCMDI), now at the Indian Institute of Technology Delhi and the lead author of the paper. “The previous research was based on looking at the combined ocean temperature observations from several different instrument types, which collectively appear to have a cooling effect. But if you look at the observational instruments individually, there is no cooling.”
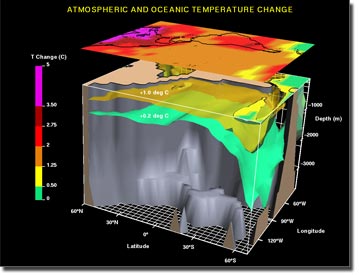
Three-dimensional view of projected surface air temperature and ocean warming due to greenhouse gases as calculated by a low-resolution GFDL coupled ocean-atmosphere climate model.
Observational estimates of ocean heat content change in the 2005 World Ocean Atlas are based on millions of individual temperature measurements; however, they are unevenly distributed in space and time. In fact, until recently, many portions of the global ocean were very poorly sampled. To get a complete four-dimensional picture of global ocean temperatures, most researchers use statistical methods to “infill” missing observational data.
Climate models provide spatially complete ocean temperature data, so unlike the incomplete observations, infilling is not required. By sampling the models only where there are observations, the Livermore team found that infilling had a pronounced effect on observed estimates of ocean variability, and brought model results closer in line with observations. Models agreed even more closely with observations when the cooling effects of intermittent volcanic eruptions were included.
The research team also looked at the impacts of changes in ocean observing systems. A warm bias in the older instruments was recently discovered by researchers in Germany. With the introduction of new instruments called Argo floats, more complete and more reliable ocean temperature measurements have become possible. The first Argo floats were deployed in the Atlantic in 2000 and their network has rapidly ramped up to several thousand floats with near-global coverage of the world’s oceans.
“This transition from a measuring system biased warm to a more realistic one appears as a cooling. Obviously, models can’t account for spurious variability caused by instrument changes,” AchutaRao said.
Other Livermore authors include Benjamin Santer, Peter Gleckler and Karl Taylor. The Japan Agency for Marine-Earth Science and Technology, the National Oceanic and Atmospheric Administration and the National Center for Atmospheric Research also contributed to this report.
Founded in 1952, Lawrence Livermore National Laboratory is a national security laboratory, with a mission to ensure national security and apply science and technology to the important issues of our time. Lawrence Livermore National Laboratory is managed by the University of California for the U.S. Department of Energy’s National Nuclear Security Administration.
The project will enable resolution and simulation of fine-scale features such as eddies associated with topography and coastal currents, aspects that are very important for a number of applications, including defence.
These models also have other applications and users - local fishing communities, primary producers and agricultural marketing authorities, government agencies responsible for ecosystem management, shipping and transport and risk management in industries such as oil and gas production.
 Deep Sea Crabs